
Ever built a beautiful DoBeacon product tour, watched it go live, and then just… wondered about its real impact? DoBeacon provides comprehensive analytics to help you understand the journey itself of your tours and answer the crucial question: 'Are users actually getting it?' We provide the data to back up your decisions.
That gnawing question, "Are users actually getting it?" has been a big one for us too. We've been heads down building a way for you to answer that with cold, hard data. And today, I'm genuinely thrilled to tell you that we've shipped it.
See Your Tours Through Your Users' Eyes
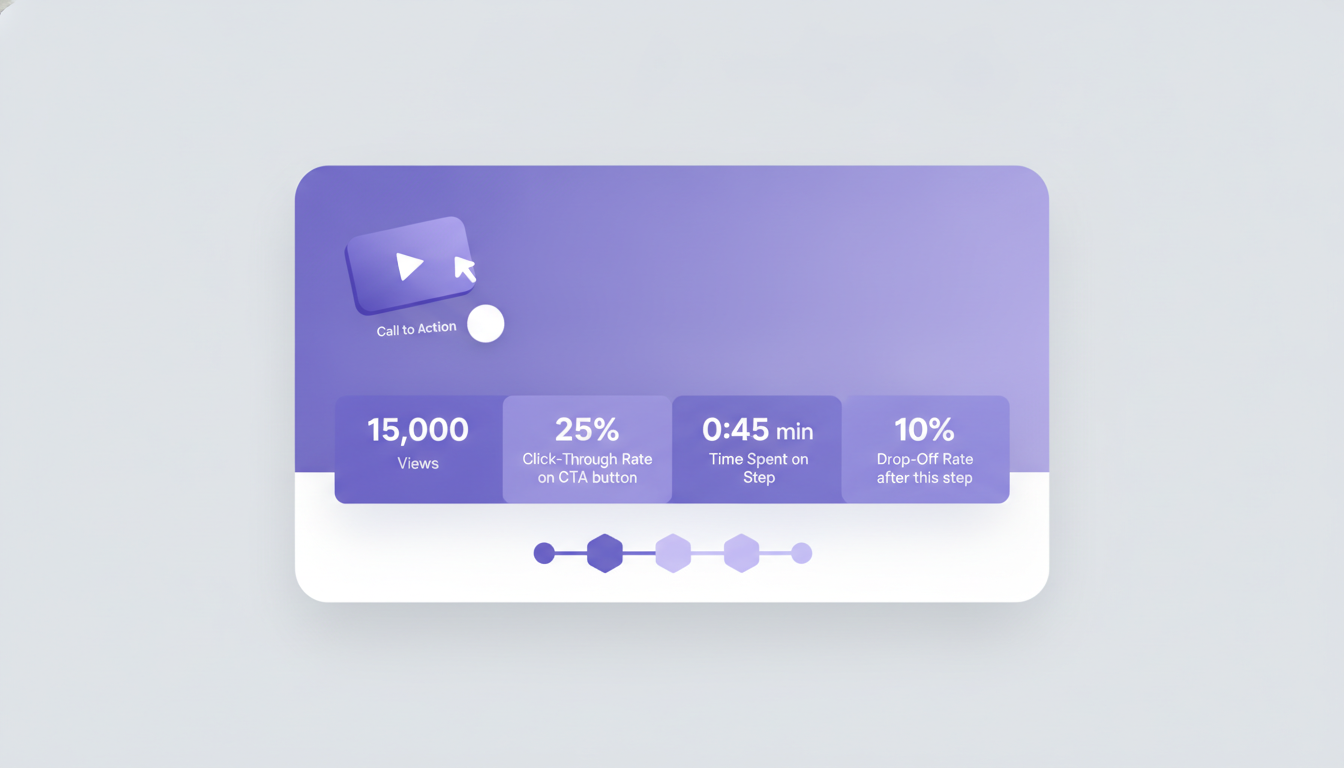
We’re talking about comprehensive analytics for your DoBeacon product tours. This isn't just a simple completion rate; this is a detailed breakdown of how users interact with every single step, every tooltip, and every microlearning module you've painstakingly crafted. Think about it: that specific button a user must click on step 4 to understand your new feature? You can now see the exact click-through rate for it. That video embed you added on step 2 explaining a complex concept? You'll know how many people viewed that step.
This level of detail changes everything. Before, if your feature adoption numbers weren't where you wanted them, you'd be guessing. Now, you can point directly to a specific tour step, see its low engagement, and know exactly where to focus your optimization efforts. Maybe the copy is confusing. Maybe the call to action isn't clear enough. Maybe, and this is a common trap, you're trying to pack too much into a single step.
What You Can Now Track (and Why It Matters)
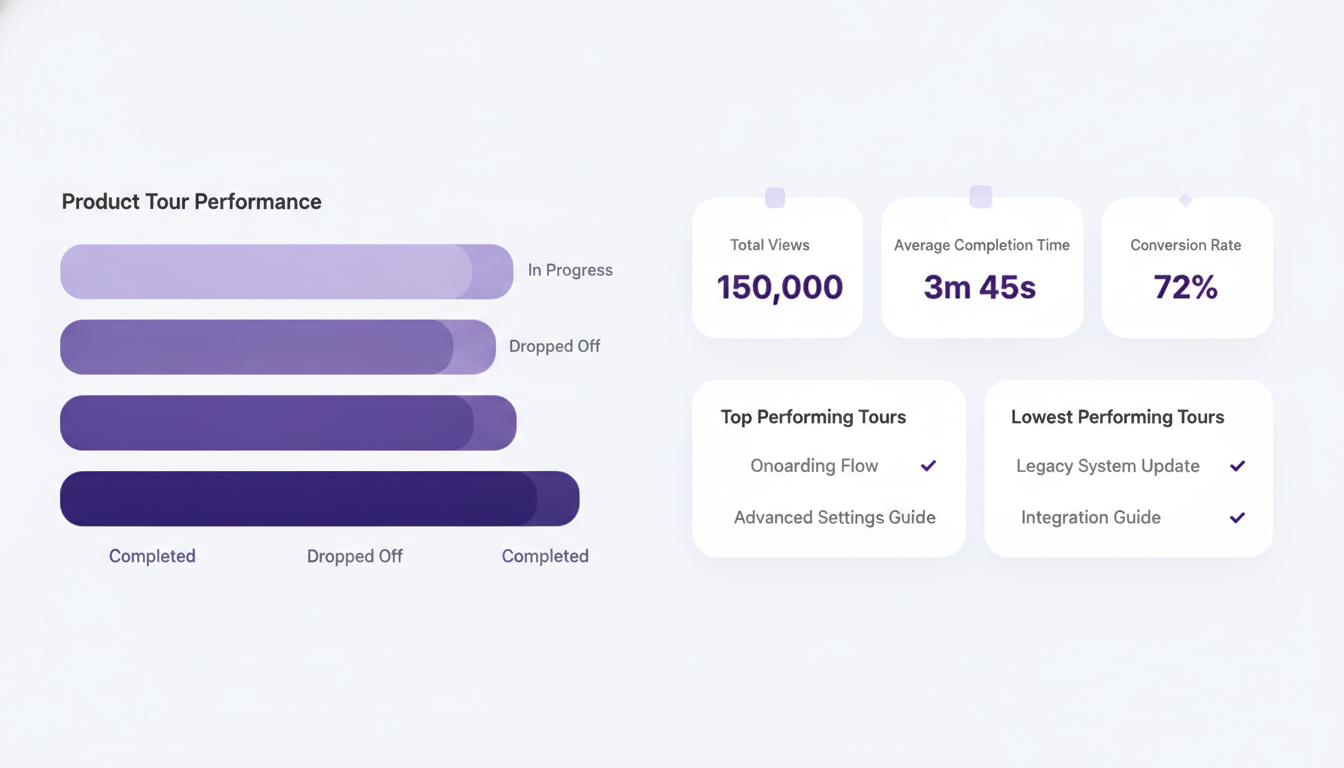
We’ve pulled together a suite of metrics designed to give you a complete picture:
- Step-by-Step Engagement: See how many users start a tour, progress through each individual step, and where they drop off. This is huge for identifying friction points. If 60% of users drop at step 3, you've found a problem worth investigating.
- Interaction Rates: Did they click that specific button? Did they view the embedded video step? We're tracking these granular interactions within your tours, letting you know if your microlearning content is actually being consumed and acted upon.
- Completion Rates: Standard, yes, but now contextualized. You'll see not just how many completed, but gain insights into their progress through individual steps.
- User Journey Insights: Understand how users progress through tours. Do they encounter friction that leads to drop-off?
Here's a thought: sometimes, a lower completion rate on a specific tour isn't a failure; it might actually mean users got what they needed faster and self-served, which is its own kind of win. If they hit step 2, understood the concept, and immediately went to use the feature in your app, that's success, even if they didn't finish the tour. Our analytics help you differentiate between constructive self-service and genuine user confusion.
Practical Magic: What You Can Do Now
Imagine you're a Product Marketing Manager launching a new reporting module in your SaaS platform. You've built a DoBeacon tour to walk users through the key features. With these analytics, you can:
- Pinpoint Confusion: Notice a sharp drop-off when users hit the step explaining advanced filters? You can immediately revise the copy, add a GIF, or break that step into two simpler ones.
- Prove Value: Your Head of Product asks for data on the effectiveness of your onboarding. Now you can show, with real numbers, how many users engaged with the "Getting Started" tour, how many clicked the 'Create Your First Report' button within it, and how that correlates with their early feature usage.
- Optimize for Action: If a tour step designed to encourage users to set up a notification preference has a low click-through on its CTA, you know to test different button copy or placement. It's no longer a hunch; it's a data-driven decision.
We believe that a well-designed product tour isn't just about showing; it's about enabling. And enabling means understanding. This is why we poured so much effort into these analytics. It’s not just about giving you more numbers; it’s about giving you the clarity and confidence to make your product education genuinely effective. It's about closing that loop between creation and impact, so you can stop guessing and start knowing.
Ready to dive into your tour data and start making smarter decisions?